Details
-
Bug
-
Status: Closed (View Workflow)
-
 Major
Major
-
Resolution: Incomplete
-
10.1.22
-
Gentoo, kernel 4.4.6, 8x Intel Xeon E5-2643 0 @ 3.30GHz, 8GB RAM, 3 Galera nodes on the same stable network (no geo-replication)
Description
Hi,
we have Galera cluster based on 3 nodes, each with latest MariaDB 10.1.22.
Today morning, one node hangs/locked on query `SHOW STATUS LIKE 'wsrep_local_state'. The same issue I've already reported 5 months ago (still unresolved issue): https://jira.mariadb.org/browse/MDEV-11312
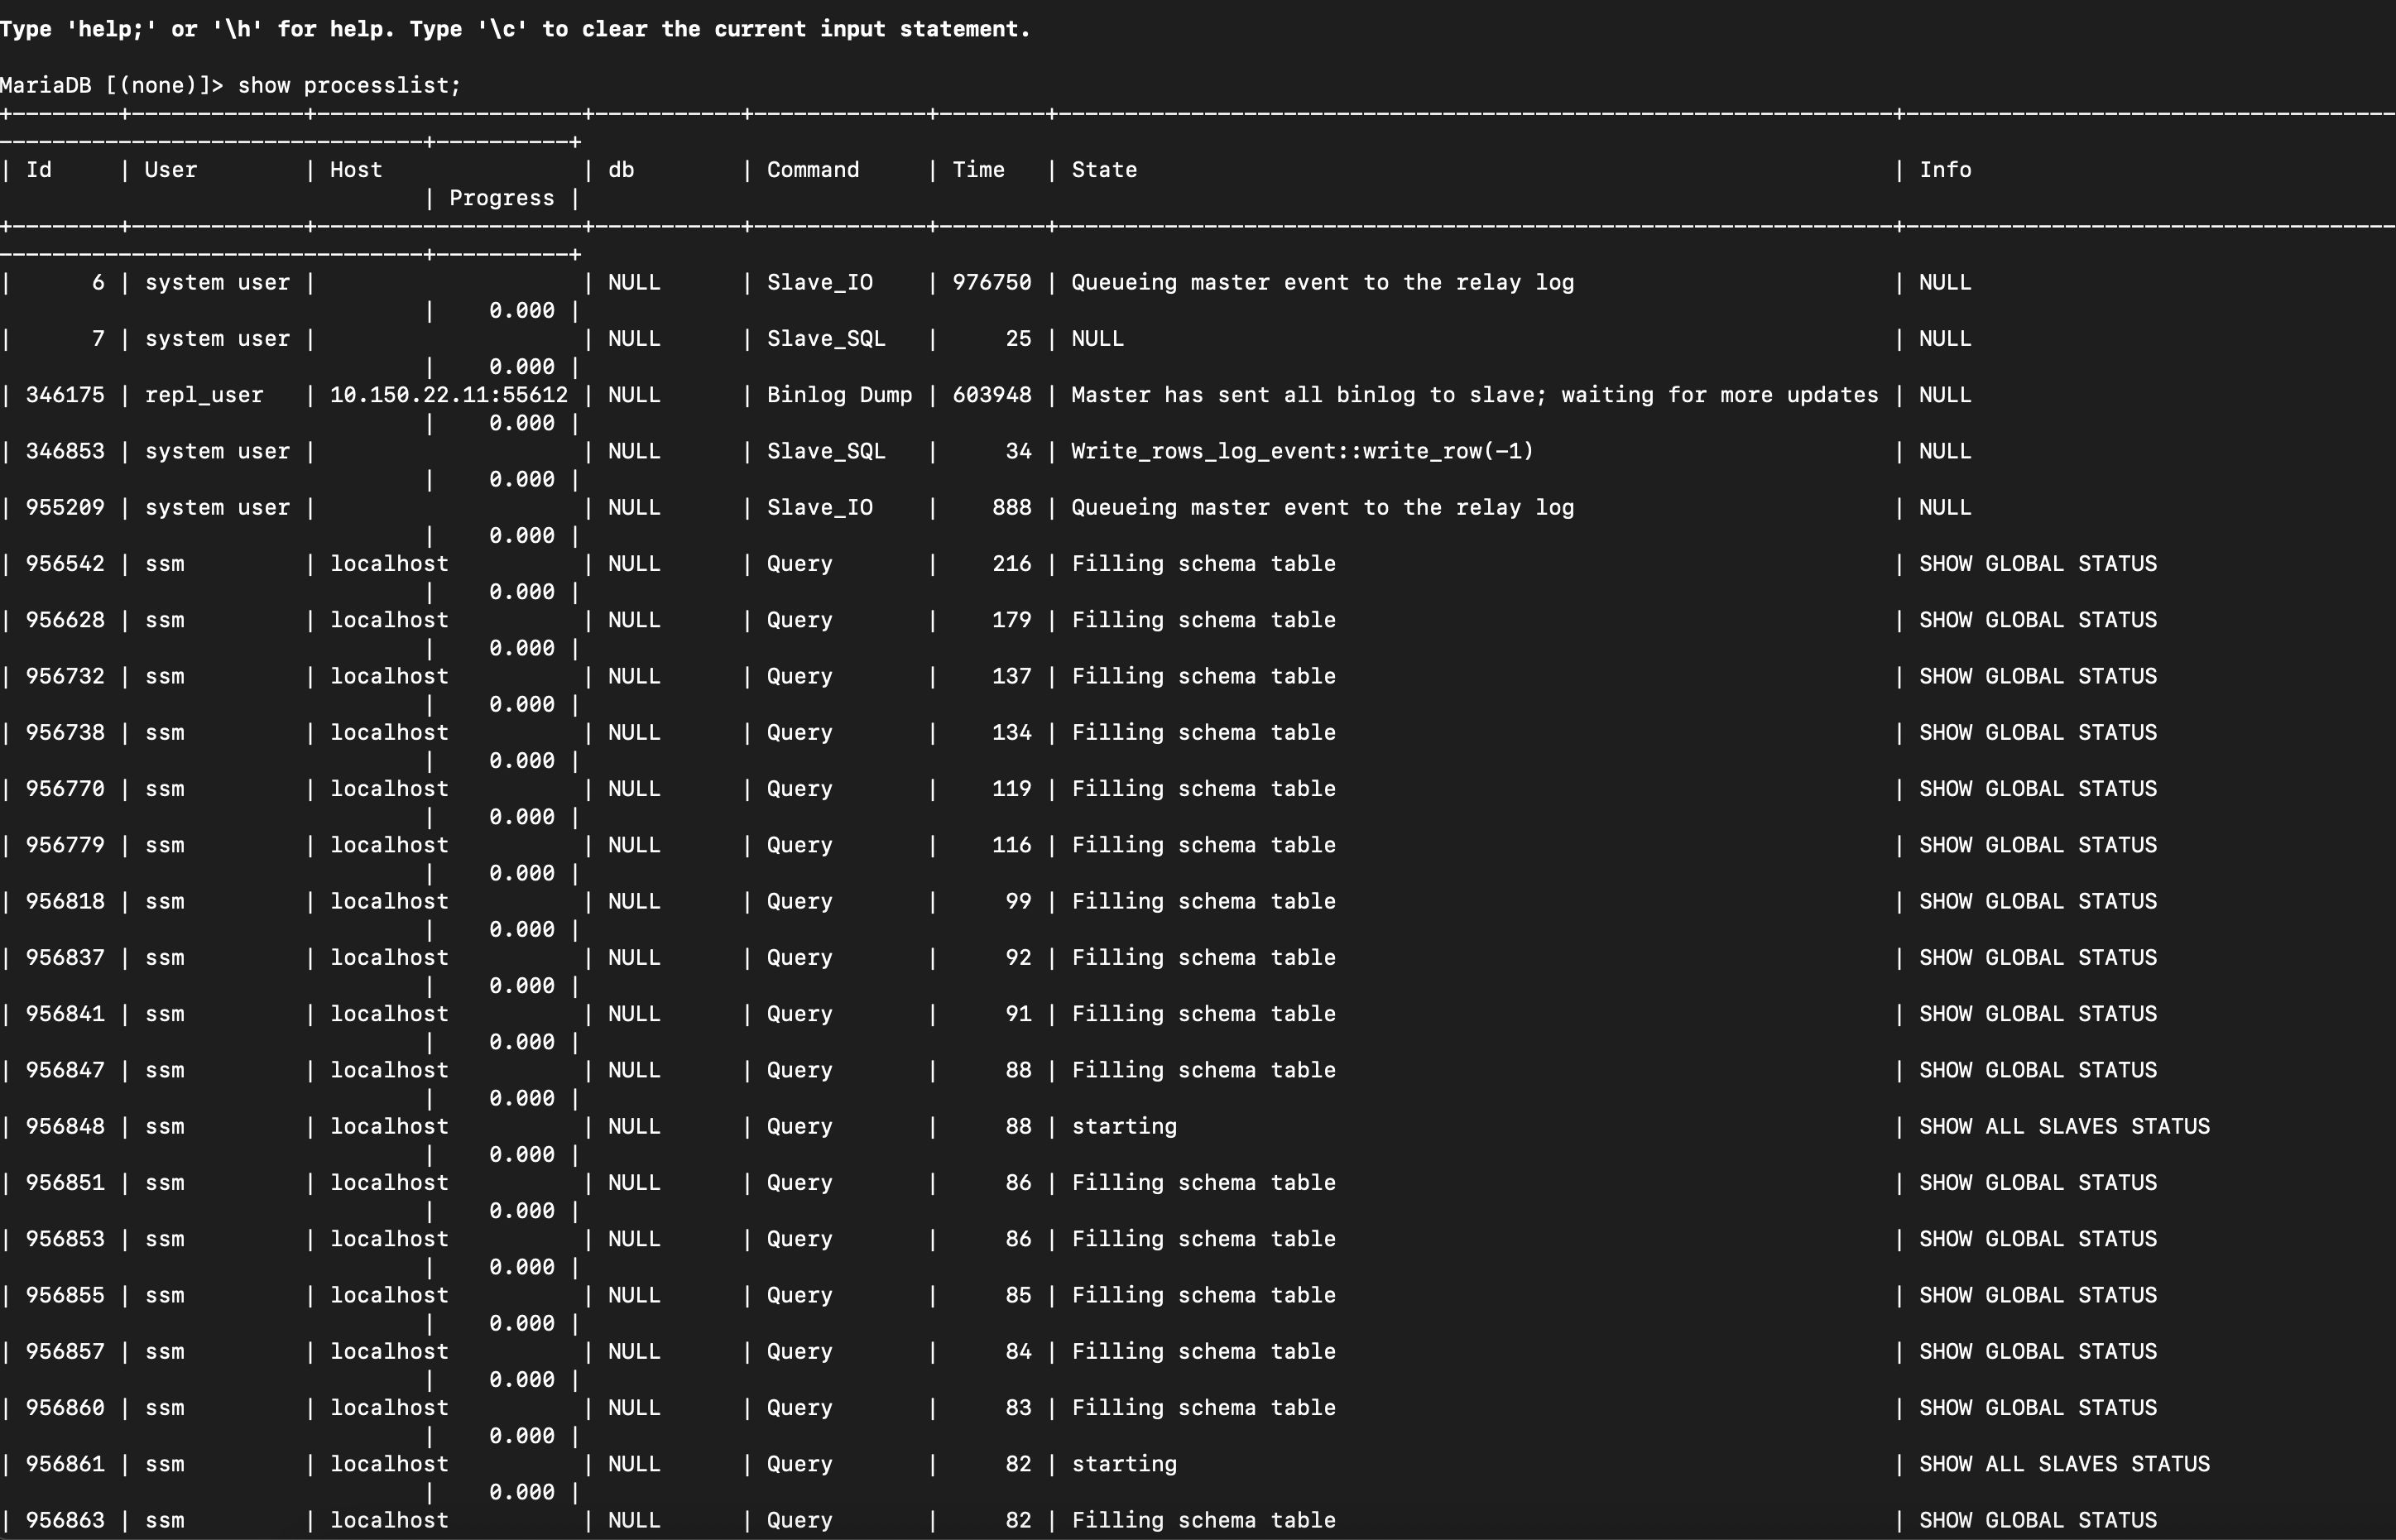
I attach full processlist from hanged time. In this time, i killed first/oldest hanged process with ID 109921.
After that, mysqld crashed immediately (i attached error log). There was no query present in an error log. At the end, there is few rows logged after my manual MySQL start.
Maybe, it is related to libjemalloc. Server has 8 GB RAM and only 2 GB are allocated, so free memory is not a problem.
Thank you for your help. It's really big issue for us. Galera is not stable already for 5 months and there is only 1 relatively small database with only 20-100 req/s. Nodes are on the same stable network with latency about ~0.3ms.
Processlist
+--------+-----------------+--------------------+------------+---------+--------+-----------------------------+------------------------------------------------------------------------------------------------------+----------+
|
| Id | User | Host | db | Command | Time | State | Info | Progress |
|
+--------+-----------------+--------------------+------------+---------+--------+-----------------------------+------------------------------------------------------------------------------------------------------+----------+
|
| 1 | system user | | | Sleep | 129115 | wsrep aborter idle | | 0.000 |
|
| 2 | system user | | | Sleep | 217 | committed 15228746 | | 0.000 |
|
| 4 | event_scheduler | localhost | | Daemon | 129112 | Waiting for next activation | | 0.000 |
|
| 5 | system user | | | Sleep | 217 | committed 15228745 | | 0.000 |
|
| 6 | system user | | | Sleep | 217 | committed 15228748 | | 0.000 |
|
| 7 | system user | | | Sleep | 217 | committed 15228743 | | 0.000 |
|
| 8 | system user | | | Sleep | 217 | committed 15228747 | | 0.000 |
|
| 10 | system user | | | Sleep | 217 | committed 15228744 | | 0.000 |
|
| 109921 | clustercheck | localhost | | Query | 214 | Filling schema table | SHOW STATUS LIKE 'wsrep_local_state' | 0.000 |
|
| 109924 | project_cz | 10.234.4.35:19083 | project_cz | Query | 213 | query end | UPDATE `geo_ip` SET `datetime_last_analysis`='2017-03-23 11:33:23' WHERE (`id` = 484297) | 0.000 |
|
| 109925 | clustercheck | localhost | | Query | 212 | Filling schema table | SHOW STATUS LIKE 'wsrep_local_state' | 0.000 |
|
| 109926 | monitoring | 10.234.3.18:45170 | | Query | 212 | Filling schema table | show global status | 0.000 |
|
| 109928 | clustercheck | localhost | | Query | 210 | Filling schema table | SHOW STATUS LIKE 'wsrep_local_state' | 0.000 |
|
| 109929 | clustercheck | localhost | | Query | 209 | Filling schema table | SHOW STATUS LIKE 'wsrep_local_state' | 0.000 |
|
| 109930 | clustercheck | localhost | | Query | 203 | Filling schema table | SHOW STATUS LIKE 'wsrep_local_state' | 0.000 |
|
| 109932 | clustercheck | localhost | | Query | 199 | Filling schema table | SHOW STATUS LIKE 'wsrep_local_state' | 0.000 |
|
| 109933 | clustercheck | localhost | | Query | 197 | Filling schema table | SHOW STATUS LIKE 'wsrep_local_state' | 0.000 |
|
| 109935 | clustercheck | localhost | | Query | 195 | Filling schema table | SHOW STATUS LIKE 'wsrep_local_state' | 0.000 |
|
| 109936 | clustercheck | localhost | | Query | 191 | Filling schema table | SHOW STATUS LIKE 'wsrep_local_state' | 0.000 |
|
| 109938 | clustercheck | localhost | | Query | 185 | Filling schema table | SHOW STATUS LIKE 'wsrep_local_state' | 0.000 |
|
| 109939 | clustercheck | localhost | | Query | 185 | Filling schema table | SHOW STATUS LIKE 'wsrep_local_state' | 0.000 |
|
| 109941 | clustercheck | localhost | | Query | 180 | Filling schema table | SHOW STATUS LIKE 'wsrep_local_state' | 0.000 |
|
| 109943 | project_cz | 10.234.4.35:19409 | project_cz | Query | 174 | query end | INSERT INTO `document__download` (`id_document`, `unique_id`, `ip`, `datetime_inserted`, `downloaded | 0.000 |
|
| 109944 | clustercheck | localhost | | Query | 171 | Filling schema table | SHOW STATUS LIKE 'wsrep_local_state' | 0.000 |
|
| 109946 | clustercheck | localhost | | Query | 165 | Filling schema table | SHOW STATUS LIKE 'wsrep_local_state' | 0.000 |
|
| 109948 | clustercheck | localhost | | Query | 157 | Filling schema table | SHOW STATUS LIKE 'wsrep_local_state' | 0.000 |
|
| 109952 | clustercheck | localhost | | Query | 150 | Filling schema table | SHOW STATUS LIKE 'wsrep_local_state' | 0.000 |
|
| 109954 | clustercheck | localhost | | Query | 143 | Filling schema table | SHOW STATUS LIKE 'wsrep_local_state' | 0.000 |
|
| 109956 | clustercheck | localhost | | Query | 136 | Filling schema table | SHOW STATUS LIKE 'wsrep_local_state' | 0.000 |
|
| 109961 | monitoring | localhost | | Query | 116 | Filling schema table | show /*!50002 GLOBAL */ status | 0.000 |
|
| 109971 | root | 192.168.2.48:50709 | | Sleep | 2 | | | 0.000 |
|
| 109981 | monitoring | 10.234.3.18:48126 | | Query | 30 | Filling schema table | show global status | 0.000 |
|
| 109986 | monitoring | localhost | | Query | 0 | init | show processlist | 0.000 |
|
+--------+-----------------+--------------------+------------+---------+--------+-----------------------------+------------------------------------------------------------------------------------------------------+----------+
|
Error log
170323 11:37:45 [ERROR] mysqld got signal 11 ;
|
This could be because you hit a bug. It is also possible that this binary
|
or one of the libraries it was linked against is corrupt, improperly built,
|
or misconfigured. This error can also be caused by malfunctioning hardware.
|
|
|
To report this bug, see https://mariadb.com/kb/en/reporting-bugs
|
|
|
We will try our best to scrape up some info that will hopefully help
|
diagnose the problem, but since we have already crashed,
|
something is definitely wrong and this may fail.
|
|
|
Server version: 10.1.22-MariaDB
|
key_buffer_size=33554432
|
read_buffer_size=1048576
|
max_used_connections=26
|
max_threads=152
|
thread_count=34
|
It is possible that mysqld could use up to
|
key_buffer_size + (read_buffer_size + sort_buffer_size)*max_threads = 347165 K bytes of memory
|
Hope that's ok; if not, decrease some variables in the equation.
|
|
|
Thread pointer: 0x7fa4a54d7008
|
Attempting backtrace. You can use the following information to find out
|
where mysqld died. If you see no messages after this, something went
|
terribly wrong...
|
stack_bottom = 0x7fa4d33ece58 thread_stack 0x80000
|
/usr/sbin/mysqld(my_print_stacktrace+0x29)[0x560cd61e43bf]
|
/usr/sbin/mysqld(handle_fatal_signal+0x327)[0x560cd5d690b5]
|
/lib64/libpthread.so.0(+0x103f0)[0x7fa59783e3f0]
|
/usr/lib64/libjemalloc.so.1(+0xc691)[0x7fa598531691]
|
/usr/lib64/libjemalloc.so.1(+0x21a0d)[0x7fa598546a0d]
|
/usr/lib64/libjemalloc.so.1(malloc+0x1f2)[0x7fa59852ac94]
|
/usr/sbin/mysqld(my_malloc+0x39)[0x560cd61e0ba0]
|
/usr/sbin/mysqld(alloc_root+0x9c)[0x560cd61da25b]
|
/usr/sbin/mysqld(memdup_root+0x14)[0x560cd61da629]
|
/usr/sbin/mysqld(+0x3d1a7c)[0x560cd5bafa7c]
|
/usr/sbin/mysqld(+0x3d21a4)[0x560cd5bb01a4]
|
/usr/sbin/mysqld(+0x3d1bce)[0x560cd5bafbce]
|
/usr/sbin/mysqld(+0x3d0703)[0x560cd5bae703]
|
/usr/sbin/mysqld(_Z16acl_authenticateP3THDj+0x1f9)[0x560cd5bc74ed]
|
/usr/sbin/mysqld(+0x4e7be7)[0x560cd5cc5be7]
|
/usr/sbin/mysqld(_Z16login_connectionP3THD+0x42)[0x560cd5cc6f6d]
|
/usr/sbin/mysqld(_Z22thd_prepare_connectionP3THD+0x11)[0x560cd5cc78e6]
|
/usr/sbin/mysqld(_Z24do_handle_one_connectionP3THD+0x177)[0x560cd5cc7a9e]
|
/usr/sbin/mysqld(handle_one_connection+0x37)[0x560cd5cc7c63]
|
/lib64/libpthread.so.0(+0x734c)[0x7fa59783534c]
|
/lib64/libc.so.6(clone+0x6d)[0x7fa596d1f52d]
|
|
|
Trying to get some variables.
|
Some pointers may be invalid and cause the dump to abort.
|
Query (0x0): is an invalid pointer
|
Connection ID (thread ID): 109996
|
Status: NOT_KILLED
|
|
|
Optimizer switch: index_merge=on,index_merge_union=on,index_merge_sort_union=on,index_merge_intersection=on,index_merge_sort_intersection=off,engine_condition_pushdown=off,index_condition_pushdown=on,derived_merge=on,derived_with_keys=on,firstmatch=on,loos
|
escan=on,materialization=on,in_to_exists=on,semijoin=on,partial_match_rowid_merge=on,partial_match_table_scan=on,subquery_cache=on,mrr=off,mrr_cost_based=off,mrr_sort_keys=off,outer_join_with_cache=on,semijoin_with_cache=on,join_cache_incremental=on,join_c
|
ache_hashed=on,join_cache_bka=on,optimize_join_buffer_size=off,table_elimination=on,extended_keys=on,exists_to_in=on,orderby_uses_equalities=off
|
|
|
The manual page at http://dev.mysql.com/doc/mysql/en/crashing.html contains
|
information that should help you find out what is causing the crash.
|
|
|
We think the query pointer is invalid, but we will try to print it anyway.
|
Query:
|
|
|
2017-03-23 11:38:18 140200819652480 [Note] WSREP: Read nil XID from storage engines, skipping position init
|
2017-03-23 11:38:18 140200819652480 [Note] WSREP: wsrep_load(): loading provider library '/usr/lib/galera/libgalera_smm.so'
|
2017-03-23 11:38:18 140200819652480 [Note] WSREP: wsrep_load(): Galera 3.17(r447d194) by Codership Oy <info@codership.com> loaded successfully.
|
2017-03-23 11:38:18 140200819652480 [Note] WSREP: CRC-32C: using "slicing-by-8" algorithm.
|
2017-03-23 11:38:18 140200819652480 [Note] WSREP: Found saved state: cb18d9d7-dc8f-11e6-9b71-37b745222498:-1
|
2017-03-23 11:38:18 140200819652480 [Note] WSREP: Passing config to GCS: base_dir = /var/lib/mysql/; base_host = 10.234.4.35; base_port = 4567; cert.log_conflicts = no; debug = no; evs.auto_evict = 0; evs.delay_margin = PT1S; evs.delayed_keep_period = PT30
|
S; evs.inactive_check_period = PT3S; evs.inactive_timeout = PT20S; evs.install_timeout = PT20S; evs.join_retrans_period = PT1S; evs.keepalive_period = PT2S; evs.max_install_timeouts = 3; evs.send_window = 8; evs.stats_report_period = PT1M; evs.suspect_time
|
out = PT10S; evs.user_send_window = 4; evs.view_forget_timeout = PT24H; gcache.dir = /var/lib/mysql/; gcache.keep_pages_size = 0; gcache.mem_size = 0; gcache.name = /var/lib/mysql//galera.cache; gcache.page_size = 512M; gcache.size = 1G; gcomm.thread_prio
|
= ; gcs.fc_debug = 0; gcs.fc_factor = 1.0; gcs.fc_limit = 16; gcs.fc_master_slave = no; gcs.max_packet_size = 64500; gcs.max_throttle = 0.25; gcs.recv_q_hard_limit = 9223372036854775807; gcs.recv_q_soft_limit = 0.25; gcs.sync_donor = no; gmcast.segment = 0
|
; gmcast.version = 0; pc.announce_timeout
|
2017-03-23 11:38:18 140199509595904 [Note] WSREP: Service thread queue flushed.
|
Attachments
Issue Links
- relates to
-
-

- Closed
-