Details
-
Bug
-
Status: Closed (View Workflow)
-
 Major
Major
-
Resolution: Not a Bug
-
10.1.12
-
None
-
OSX
Description
I have installed mariadb using homebrew on my development machine. It starts at boot time, but if I am not actively working on my local development environment, no queries are running. Despite no activity, mariadb is using 100% of my CPU. Stopping the service has been my only option.
Attachments

Issue Links
- relates to
-
-

- Closed
-
Activity
| Field | Original Value | New Value |
|---|---|---|
| Labels | need_feedback |
Would love to, but I'm not seeing information anywhere on how to get one if mariadb hasn't crashed.
You can do the following, assuming lldb is installed on your machine:
$ ps -ax | grep mysqld
<get the pid of mysqld>
$ lldb
(lldb) process attach --pid <pid of mysqld>
(lldb) thread backtrace all
// Stack traces for all threads.
| Attachment | Activity_Monitor__All_Processes_1.png [ 41963 ] |
| Attachment | stack1.txt [ 41964 ] |
Thank you, Vicentiu.
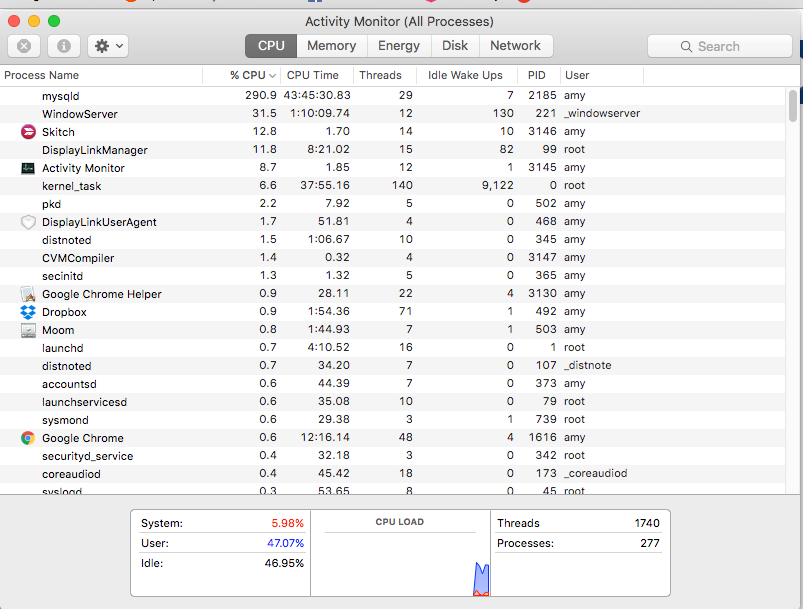
I started mariadb this morning around 8am. At first, the CPU usage is fine. But, by 11 am, it was over 200%. I grabbed a stacktrace per the above directions. I am enclosing it. Something interesting happened. Doing the stacktrace made the CPU usage drop again. I'm also attaching a picture of activity monitor that shows it dropped drastically. I will grab more traces again once the load increases.
This is interesting. The second I attach the lldb debugger to the mariadb process, the CPU usage immediate drops - before I get a chance to do the trace. If I exit lldb, the CPU usage goes up again. So, I'm not sure a trace is going to capture the problem in action.
The CPU usage makes sense. The reason why this happens is that when you attach lldb, the process is halted. If you send lldb the continue command, the CPU usage should go back to where it was before.
The thing that could be the culprit is:
thread #27: tid = 0x68743, 0x000000010239fbf2 mysqld`fil_space_get_by_id(unsigned long) + 30
frame #0: 0x000000010239fbf2 mysqld`fil_space_get_by_id(unsigned long) + 30
frame #1: 0x00000001023aff89 mysqld`fil_space_get_crypt_data(unsigned long) + 247
frame #2: 0x00000001023b3590 mysqld`fil_crypt_find_space_to_rotate(key_state_t*, rotate_thread_t*, bool*) + 1583
frame #3: 0x00000001023b473e mysqld`fil_crypt_thread + 763
frame #4: 0x00007fff81ef499d libsystem_pthread.dylib`_pthread_body + 131
frame #5: 0x00007fff81ef491a libsystem_pthread.dylib`_pthread_start + 168
frame #6: 0x00007fff81ef2351 libsystem_pthread.dylib`thread_start + 13
This seems to be the thread that is actually performing some work.
amykhar, thanks for providing the stack trace.Please also attach your cnf file(s).
jplindst, since encryption is the main suspect here, could you please take a look?
| Fix Version/s | 10.1 [ 16100 ] | |
| Assignee | Jan Lindström [ jplindst ] |
| Attachment | my.cnf [ 41966 ] |
| Description | I have installed mariadb using homebrew on my development machine. It starts at boot time, but if I am not actively working on my local development environment, no queries are running. Despite no activity, mariadb is using 1000% of my CPU. Stopping the service has been my only option. | I have installed mariadb using homebrew on my development machine. It starts at boot time, but if I am not actively working on my local development environment, no queries are running. Despite no activity, mariadb is using 100% of my CPU. Stopping the service has been my only option. |
| Labels | need_feedback |
This is not a bug. You have background key rotation enabled i.e. InnoDB background threads (4 in you case) are doing periodically check does one of the tablespaces need a key rotation. You can disable background key rotation either by setting innodb-encryption-rotate-key-age=0, note that this will also disable system tablespace key rotation and here key rotation means also unencrypted to encrypted state change.
| Component/s | Encryption [ 11200 ] | |
| Fix Version/s | N/A [ 14700 ] | |
| Fix Version/s | 10.1 [ 16100 ] | |
| Resolution | Not a Bug [ 6 ] | |
| Status | Open [ 1 ] | Closed [ 6 ] |
| Link |
This issue relates to |
| Workflow | MariaDB v3 [ 74647 ] | MariaDB v4 [ 150256 ] |
Can you acquire a stack trace (or better several consequent stack traces) from the running server?