Details
-
Bug
-
Status: Closed (View Workflow)
-
 Critical
-
Resolution: Fixed
-
10.4.6, 10.4.7, 10.4.8
-
Docker image from docker-hub, 10.4.6-bionic 3-node galera setup on a debian 10 host.
Only one instance is receiving live queries, two are passive nodes (or used readonly for backups)
256GB host memory
InnoDB tables only
Description
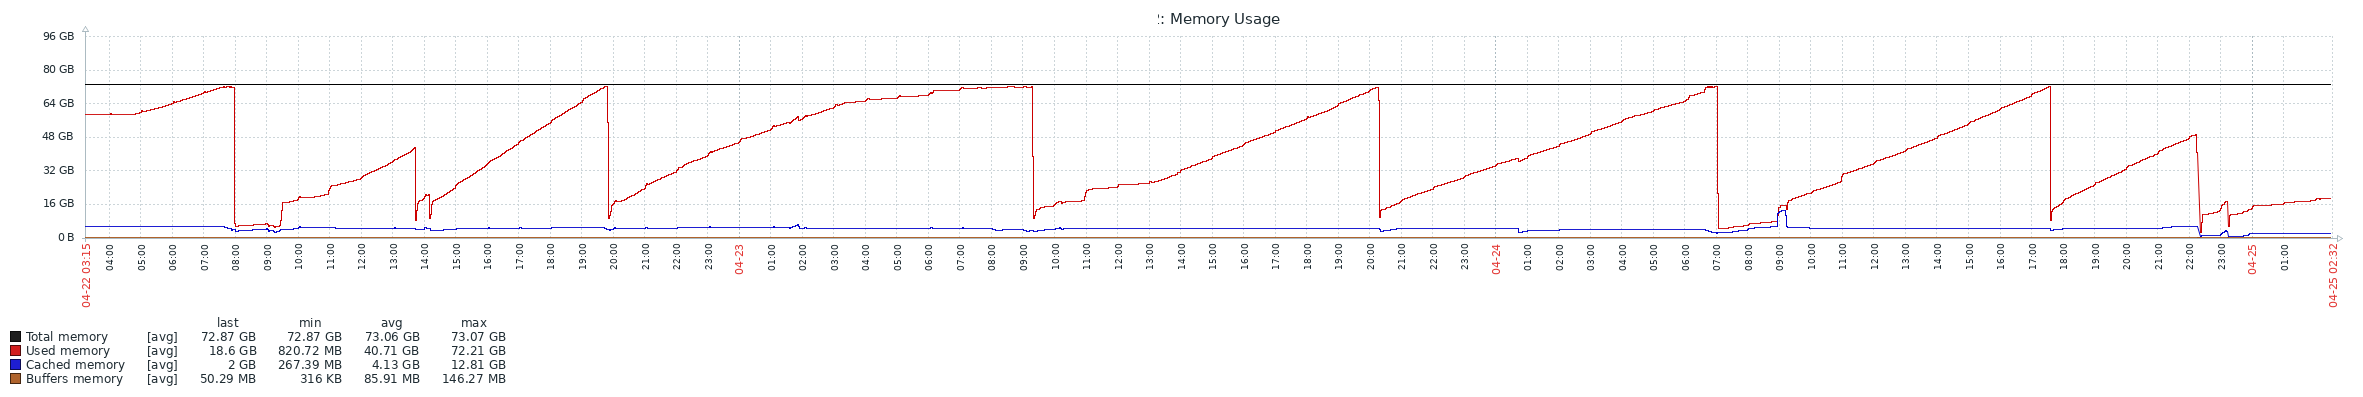
MariaDB is configured for 64GB Innodb buffer_pool, which should lead to approx. 70-80GB of Memory consumption.
Over time, this increases, sometimes in larger steps, sometimes gradually. After 47h of "uptime" we are currently at:
top - 15:25:11 up 1 day, 22:48, 1 user, load average: 3.28, 3.71, 3.77
|
Tasks: 299 total, 1 running, 296 sleeping, 0 stopped, 2 zombie
|
%Cpu(s): 10.0 us, 10.0 sy, 0.0 ni, 80.0 id, 0.0 wa, 0.0 hi, 0.0 si, 0.0 st
|
MiB Mem : 257612.1 total, 84072.2 free, 163291.2 used, 10248.6 buff/cache
|
MiB Swap: 4768.0 total, 4768.0 free, 0.0 used. 92118.7 avail Mem
|
|
|
PID USER PR NI VIRT RES SHR S %CPU %MEM TIME+ COMMAND
|
2430 mysqld-docker 20 0 198.9g 163.5g 8.0g S 400.0 65.0 11415:05 mysqld
|
this will in the end lead to an OOM condition in some days, but after OOM-kill, the galera IST will not work, triggering MDEV-20218 and in consequence break the whole cluster, because after some tries no donor is available and all nodes are DESYNC and writing replication logs to disk.
Unfortunately, MDEV-16431 seems not ready yet. How can I debug this?
MariaDB [my_db]> show global status like '%memory%';
|
+---------------------+-----------+
|
| Variable_name | Value |
|
+---------------------+-----------+
|
| Memory_used | 906490496 |
|
| Memory_used_initial | 139670856 |
|
| Qcache_free_memory | 0 |
|
+---------------------+-----------+
|
3 rows in set (0.002 sec)
|
BUFFER POOL AND MEMORY
|
----------------------
|
Total large memory allocated 71135395840
|
Dictionary memory allocated 878832
|
Buffer pool size 4230336
|
Free buffers 1677346
|
Database pages 2430350
|
Old database pages 897500
|
Modified db pages 29090
|
Percent of dirty pages(LRU & free pages): 0.708
|
Max dirty pages percent: 75.000
|
Pending reads 0
|
Pending writes: LRU 0, flush list 0, single page 0
|
Pages made young 29835, not young 0
|
0.00 youngs/s, 0.00 non-youngs/s
|
Pages read 2305059, created 125291, written 47846699
|
0.00 reads/s, 0.00 creates/s, 218.39 writes/s
|
Buffer pool hit rate 1000 / 1000, young-making rate 0 / 1000 not 0 / 1000
|
Pages read ahead 0.00/s, evicted without access 0.00/s, Random read ahead 0.00/s
|
LRU len: 2430350, unzip_LRU len: 0
|
I/O sum[0]:cur[0], unzip sum[0]:cur[0]
|
Please find the config file attached.
The memory consumtion is probably triggered by client access, because if we redirect our loadbalancer to the next backend, memory grows there. OTOH, memory usage won't decrease when not receiving queries, even after days. (Had to cut the experiment after 3 days, because node2/3 was threatening to break down)
Attachments


Issue Links
- relates to
-
MDEV-16431 merge 5.7 P_S memory instrumentation and tables
-

- Closed
-
-
-
- Closed
-
-
-

- Closed
-
Activity
| Field | Original Value | New Value |
|---|---|---|
| Link |
This issue relates to |
| Link |
This issue relates to |
| Description |
MariaDB is configured for 64GB Innodb buffer_pool, which should lead to approx. 70-80GB of Memory consumption.
Over time, this increases, sometimes in larger steps, sometimes gradually. After 47h of "uptime" we are currently at: {quote}top - 15:25:11 up 1 day, 22:48, 1 user, load average: 3.28, 3.71, 3.77 Tasks: 299 total, 1 running, 296 sleeping, 0 stopped, 2 zombie %Cpu(s): 10.0 us, 10.0 sy, 0.0 ni, 80.0 id, 0.0 wa, 0.0 hi, 0.0 si, 0.0 st MiB Mem : 257612.1 total, 84072.2 free, 163291.2 used, 10248.6 buff/cache MiB Swap: 4768.0 total, 4768.0 free, 0.0 used. 92118.7 avail Mem PID USER PR NI VIRT RES SHR S %CPU %MEM TIME+ COMMAND 2430 mysqld-docker 20 0 198.9g 163.5g 8.0g S 400.0 65.0 11415:05 mysqld {quote} this will in the end lead to an OOM condition in some days, but after OOM-kill, the galera IST will not work, triggering https://jira.mariadb.org/browse/MDEV-20218 and in consequence break the whole cluster, because after some tries no donor is available and all nodes are DESYNC and writing replication logs to disk. Unfortunately, https://jira.mariadb.org/browse/MDEV-16431 seems not ready yet. How can I debug this? {quote}MariaDB [my_db]> show global status like '%memory%'; +---------------------+-----------+ | Variable_name | Value | +---------------------+-----------+ | Memory_used | 906490496 | | Memory_used_initial | 139670856 | | Qcache_free_memory | 0 | +---------------------+-----------+ 3 rows in set (0.002 sec){quote} {quote}BUFFER POOL AND MEMORY ---------------------- Total large memory allocated 71135395840 Dictionary memory allocated 878832 Buffer pool size 4230336 Free buffers 1677346 Database pages 2430350 Old database pages 897500 Modified db pages 29090 Percent of dirty pages(LRU & free pages): 0.708 Max dirty pages percent: 75.000 Pending reads 0 Pending writes: LRU 0, flush list 0, single page 0 Pages made young 29835, not young 0 0.00 youngs/s, 0.00 non-youngs/s Pages read 2305059, created 125291, written 47846699 0.00 reads/s, 0.00 creates/s, 218.39 writes/s Buffer pool hit rate 1000 / 1000, young-making rate 0 / 1000 not 0 / 1000 Pages read ahead 0.00/s, evicted without access 0.00/s, Random read ahead 0.00/s LRU len: 2430350, unzip_LRU len: 0 I/O sum[0]:cur[0], unzip sum[0]:cur[0]{quote} Please find the config file attached. |
MariaDB is configured for 64GB Innodb buffer_pool, which should lead to approx. 70-80GB of Memory consumption.
Over time, this increases, sometimes in larger steps, sometimes gradually. After 47h of "uptime" we are currently at: {quote}top - 15:25:11 up 1 day, 22:48, 1 user, load average: 3.28, 3.71, 3.77 Tasks: 299 total, 1 running, 296 sleeping, 0 stopped, 2 zombie %Cpu(s): 10.0 us, 10.0 sy, 0.0 ni, 80.0 id, 0.0 wa, 0.0 hi, 0.0 si, 0.0 st MiB Mem : 257612.1 total, 84072.2 free, 163291.2 used, 10248.6 buff/cache MiB Swap: 4768.0 total, 4768.0 free, 0.0 used. 92118.7 avail Mem PID USER PR NI VIRT RES SHR S %CPU %MEM TIME+ COMMAND 2430 mysqld-docker 20 0 198.9g 163.5g 8.0g S 400.0 65.0 11415:05 mysqld {quote} this will in the end lead to an OOM condition in some days, but after OOM-kill, the galera IST will not work, triggering https://jira.mariadb.org/browse/MDEV-20218 and in consequence break the whole cluster, because after some tries no donor is available and all nodes are DESYNC and writing replication logs to disk. Unfortunately, https://jira.mariadb.org/browse/MDEV-16431 seems not ready yet. How can I debug this? {quote}MariaDB [my_db]> show global status like '%memory%'; +---------------------+-----------+ | Variable_name | Value | +---------------------+-----------+ | Memory_used | 906490496 | | Memory_used_initial | 139670856 | | Qcache_free_memory | 0 | +---------------------+-----------+ 3 rows in set (0.002 sec){quote} {quote}BUFFER POOL AND MEMORY ---------------------- Total large memory allocated 71135395840 Dictionary memory allocated 878832 Buffer pool size 4230336 Free buffers 1677346 Database pages 2430350 Old database pages 897500 Modified db pages 29090 Percent of dirty pages(LRU & free pages): 0.708 Max dirty pages percent: 75.000 Pending reads 0 Pending writes: LRU 0, flush list 0, single page 0 Pages made young 29835, not young 0 0.00 youngs/s, 0.00 non-youngs/s Pages read 2305059, created 125291, written 47846699 0.00 reads/s, 0.00 creates/s, 218.39 writes/s Buffer pool hit rate 1000 / 1000, young-making rate 0 / 1000 not 0 / 1000 Pages read ahead 0.00/s, evicted without access 0.00/s, Random read ahead 0.00/s LRU len: 2430350, unzip_LRU len: 0 I/O sum[0]:cur[0], unzip sum[0]:cur[0]{quote} Please find the config file attached. The memory consumtion is probably triggered by client access, because if we redirect our loadbalancer to the next backend, memory grows there. OTOH, memory usage won't decrease when not receiving queries, even after days. (Had to cut the experiment after 3 days, because node2/3 was threatening to break down) |
| Fix Version/s | 10.4 [ 22408 ] | |
| Assignee | Jan Lindström [ jplindst ] |
| Labels | Memory_leak galera | Memory_leak |
| Affects Version/s | 10.4.8 [ 23721 ] | |
| Affects Version/s | 10.4.7 [ 23720 ] |
| Summary | memory leak in 10.4.6-galera? | memory leak in 10.4 series |
| Assignee | Jan Lindström [ jplindst ] | Elena Stepanova [ elenst ] |
| Assignee | Elena Stepanova [ elenst ] | Sergey Vojtovich [ svoj ] |
| Component/s | Server [ 13907 ] | |
| Component/s | Galera [ 10124 ] |
| Assignee | Sergey Vojtovich [ svoj ] | Oleksandr Byelkin [ sanja ] |
| Description |
MariaDB is configured for 64GB Innodb buffer_pool, which should lead to approx. 70-80GB of Memory consumption.
Over time, this increases, sometimes in larger steps, sometimes gradually. After 47h of "uptime" we are currently at: {quote}top - 15:25:11 up 1 day, 22:48, 1 user, load average: 3.28, 3.71, 3.77 Tasks: 299 total, 1 running, 296 sleeping, 0 stopped, 2 zombie %Cpu(s): 10.0 us, 10.0 sy, 0.0 ni, 80.0 id, 0.0 wa, 0.0 hi, 0.0 si, 0.0 st MiB Mem : 257612.1 total, 84072.2 free, 163291.2 used, 10248.6 buff/cache MiB Swap: 4768.0 total, 4768.0 free, 0.0 used. 92118.7 avail Mem PID USER PR NI VIRT RES SHR S %CPU %MEM TIME+ COMMAND 2430 mysqld-docker 20 0 198.9g 163.5g 8.0g S 400.0 65.0 11415:05 mysqld {quote} this will in the end lead to an OOM condition in some days, but after OOM-kill, the galera IST will not work, triggering https://jira.mariadb.org/browse/MDEV-20218 and in consequence break the whole cluster, because after some tries no donor is available and all nodes are DESYNC and writing replication logs to disk. Unfortunately, https://jira.mariadb.org/browse/MDEV-16431 seems not ready yet. How can I debug this? {quote}MariaDB [my_db]> show global status like '%memory%'; +---------------------+-----------+ | Variable_name | Value | +---------------------+-----------+ | Memory_used | 906490496 | | Memory_used_initial | 139670856 | | Qcache_free_memory | 0 | +---------------------+-----------+ 3 rows in set (0.002 sec){quote} {quote}BUFFER POOL AND MEMORY ---------------------- Total large memory allocated 71135395840 Dictionary memory allocated 878832 Buffer pool size 4230336 Free buffers 1677346 Database pages 2430350 Old database pages 897500 Modified db pages 29090 Percent of dirty pages(LRU & free pages): 0.708 Max dirty pages percent: 75.000 Pending reads 0 Pending writes: LRU 0, flush list 0, single page 0 Pages made young 29835, not young 0 0.00 youngs/s, 0.00 non-youngs/s Pages read 2305059, created 125291, written 47846699 0.00 reads/s, 0.00 creates/s, 218.39 writes/s Buffer pool hit rate 1000 / 1000, young-making rate 0 / 1000 not 0 / 1000 Pages read ahead 0.00/s, evicted without access 0.00/s, Random read ahead 0.00/s LRU len: 2430350, unzip_LRU len: 0 I/O sum[0]:cur[0], unzip sum[0]:cur[0]{quote} Please find the config file attached. The memory consumtion is probably triggered by client access, because if we redirect our loadbalancer to the next backend, memory grows there. OTOH, memory usage won't decrease when not receiving queries, even after days. (Had to cut the experiment after 3 days, because node2/3 was threatening to break down) |
MariaDB is configured for 64GB Innodb buffer_pool, which should lead to approx. 70-80GB of Memory consumption.
Over time, this increases, sometimes in larger steps, sometimes gradually. After 47h of "uptime" we are currently at: {noformat}top - 15:25:11 up 1 day, 22:48, 1 user, load average: 3.28, 3.71, 3.77 Tasks: 299 total, 1 running, 296 sleeping, 0 stopped, 2 zombie %Cpu(s): 10.0 us, 10.0 sy, 0.0 ni, 80.0 id, 0.0 wa, 0.0 hi, 0.0 si, 0.0 st MiB Mem : 257612.1 total, 84072.2 free, 163291.2 used, 10248.6 buff/cache MiB Swap: 4768.0 total, 4768.0 free, 0.0 used. 92118.7 avail Mem PID USER PR NI VIRT RES SHR S %CPU %MEM TIME+ COMMAND 2430 mysqld-docker 20 0 198.9g 163.5g 8.0g S 400.0 65.0 11415:05 mysqld {noformat} this will in the end lead to an OOM condition in some days, but after OOM-kill, the galera IST will not work, triggering Unfortunately, {noformat}MariaDB [my_db]> show global status like '%memory%'; +---------------------+-----------+ | Variable_name | Value | +---------------------+-----------+ | Memory_used | 906490496 | | Memory_used_initial | 139670856 | | Qcache_free_memory | 0 | +---------------------+-----------+ 3 rows in set (0.002 sec){noformat} {noformat}BUFFER POOL AND MEMORY ---------------------- Total large memory allocated 71135395840 Dictionary memory allocated 878832 Buffer pool size 4230336 Free buffers 1677346 Database pages 2430350 Old database pages 897500 Modified db pages 29090 Percent of dirty pages(LRU & free pages): 0.708 Max dirty pages percent: 75.000 Pending reads 0 Pending writes: LRU 0, flush list 0, single page 0 Pages made young 29835, not young 0 0.00 youngs/s, 0.00 non-youngs/s Pages read 2305059, created 125291, written 47846699 0.00 reads/s, 0.00 creates/s, 218.39 writes/s Buffer pool hit rate 1000 / 1000, young-making rate 0 / 1000 not 0 / 1000 Pages read ahead 0.00/s, evicted without access 0.00/s, Random read ahead 0.00/s LRU len: 2430350, unzip_LRU len: 0 I/O sum[0]:cur[0], unzip sum[0]:cur[0]{noformat} Please find the config file attached. The memory consumtion is probably triggered by client access, because if we redirect our loadbalancer to the next backend, memory grows there. OTOH, memory usage won't decrease when not receiving queries, even after days. (Had to cut the experiment after 3 days, because node2/3 was threatening to break down) |
| Attachment | swap-leak-10-4-13-1.png [ 52989 ] |
| Attachment | swap-zoom-10-4-13-1.png [ 52990 ] |
| Attachment | galera-4months-swap.png [ 52991 ] |
| Fix Version/s | 10.4.14 [ 24305 ] | |
| Fix Version/s | 10.4 [ 22408 ] | |
| Resolution | Fixed [ 1 ] | |
| Status | Open [ 1 ] | Closed [ 6 ] |
| Attachment | Screen Shot 2021-03-29 at 4.59.41 PM.png [ 56888 ] |
| Attachment | Screen Shot 2021-03-29 at 4.59.41 PM.png [ 56889 ] |
| Attachment | Screen Shot 2021-03-29 at 4.59.41 PM.png [ 56890 ] |
| Attachment | Screen Shot 2021-03-29 at 5.13.40 PM.png [ 56891 ] |
| Attachment | Screen Shot 2021-03-29 at 4.59.41 PM.png [ 56889 ] |
| Attachment | Screen Shot 2021-03-29 at 4.59.41 PM.png [ 56890 ] |
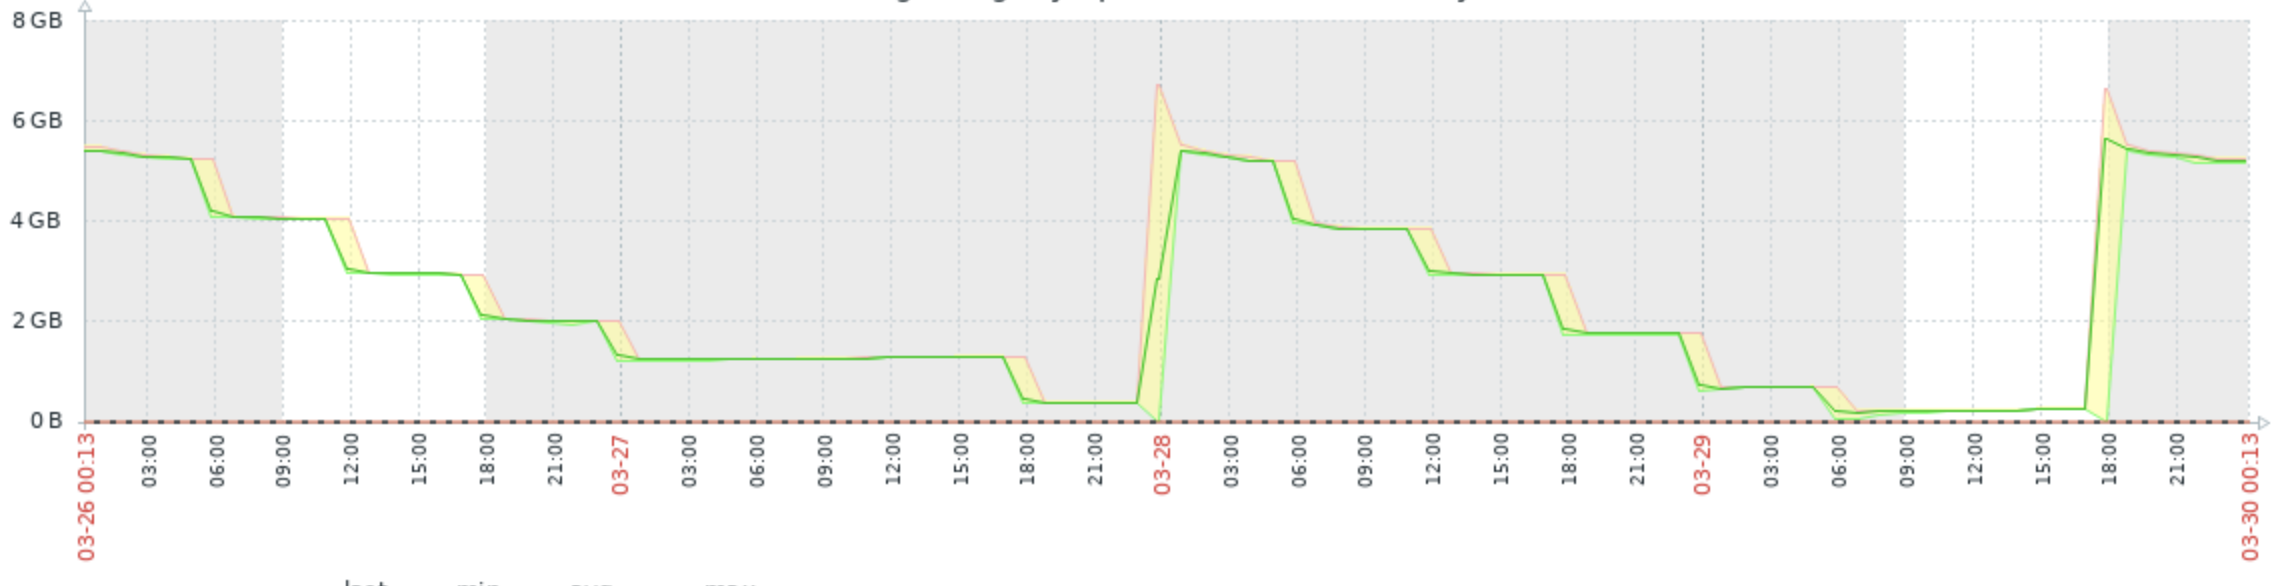
| Attachment | chart2.png [ 57518 ] |
| Comment |
[ Same setup on three node cluster , MariaDB 10.5.9 and bug is still here.
!chart2.png|thumbnail! ] |
| Link | This issue relates to MENT-1315 [ MENT-1315 ] |
| Link | This issue is duplicated by MENT-1315 [ MENT-1315 ] |
| Link | This issue relates to MENT-1315 [ MENT-1315 ] |
| Link | This issue is duplicated by MENT-1315 [ MENT-1315 ] |
| Link |
This issue relates to |
| Link | This issue relates to MENT-1315 [ MENT-1315 ] |
| Component/s | Galera [ 10124 ] | |
| Labels | Memory_leak | Memory_leak wsrep |
| Workflow | MariaDB v3 [ 99336 ] | MariaDB v4 [ 156686 ] |