Uploaded image for project: 'MariaDB Server'
  1. MariaDB Server
  2. MDEV-12205

MariaDB 10.1.21 Per-query timeout prefixes leak memory (confirmed)

Details

    • Bug
    • Status: Open (View Workflow)
    • Major
    • Resolution: Unresolved
    • 10.1.21
    • None
    • None
    • None
    • OS: CentOS 7
      Physical/Virtual: Can reproduce on both vm and hardware, but primarily on physical. 1TB memory, dual 12x core CPU.

    Description

      I have a 720GB database, 808GB innodb_buffer_cache, 1TB system memory and 10 tables. For all I can figure we shouldn’t be running out of memory, however, the mysqld process steadily increases in memory consumption until OOM killer rightfully claims it (we now restart it before that happens). After finding some relevant memory leak fixes released in 10.1.21 we upgraded to that from 10.1.13, but unfortunately it didn’t help.

      Running mysqltuner.pl (https://github.com/major/MySQLTuner-perl) seems to agree that we shouldn’t be using more than 809 GB.

      mysqltuner snippet

      [--] Total buffers: 806.4G global + 2.9M per thread (1000 max threads)
      [OK] Maximum reached memory usage: 808.2G (80.21% of installed RAM)
      [OK] Maximum possible memory usage: 809.2G (80.31% of installed RAM)
      

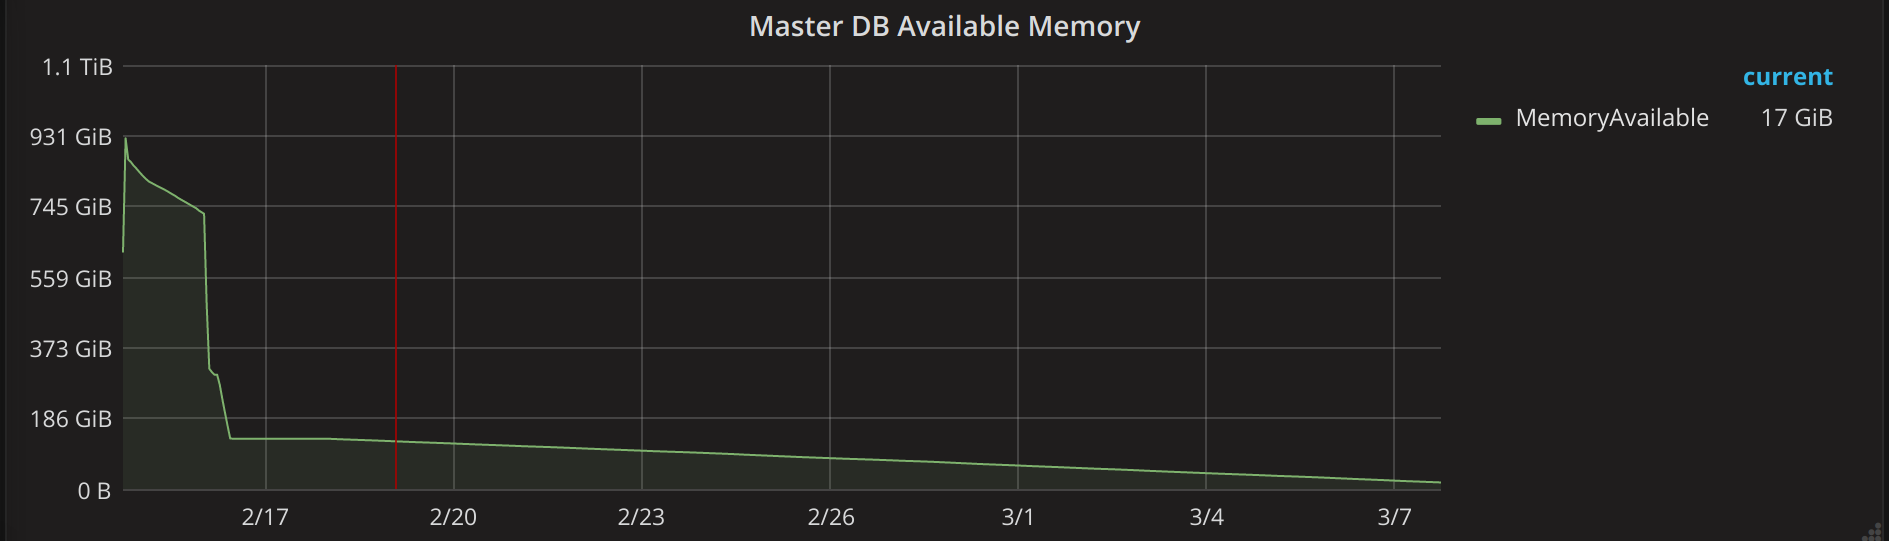
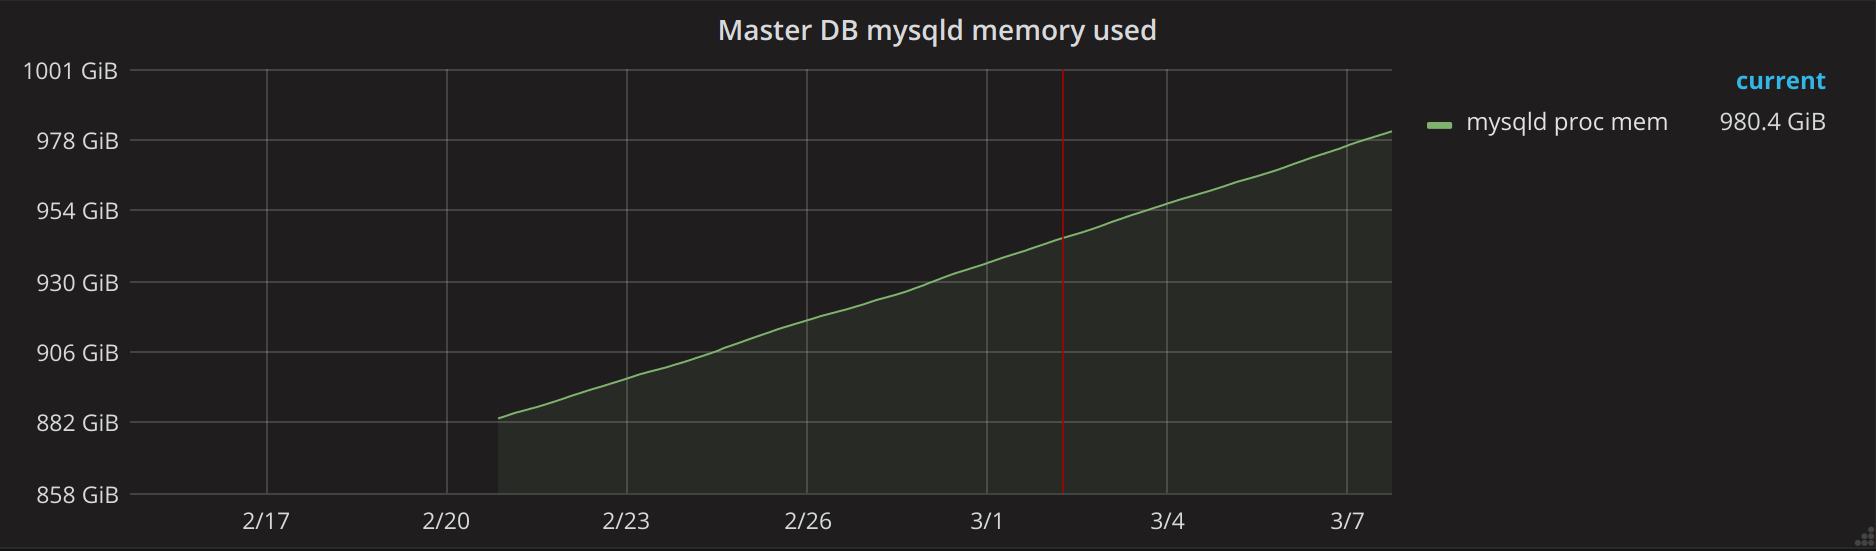
      At the time this data was gathered, the mysqld process was at 980GB. (gathered with `ps -eo pid,comm,rss`), leaving the available system memory at 17GB.

      I can consistently reproduce this with similar workload on a scaled down test instance.

      I have attached a binlog from my test instance, show variables, and a few grafana graphs.

      Thanks for taking a look!

      Attachments

        1. binlog.000099.gz
          6.30 MB
        2. master_db_memory.png
          master_db_memory.png
          42 kB
        3. master_db_mysqld_memory.png
          master_db_mysqld_memory.png
          48 kB
        4. show_variables.csv
          17 kB

        Activity

          danblack Daniel Black added a comment -

          Disclaimer: this is a rough concept only that require testing in a non-production environment obviously.
          Disclaimer 2: This is general advice from a community user and I also don't have much time but feel your pain enough to offer this on an as is basis.

          I'd be looking at something like this to use gdb to attach to the running process and print out information http://www.outofcore.com/2011/06/scripted-debug-using-gdb/.

          So trapped points would be (from source mysys/my_malloc.c):
          https://github.com/MariaDB/server/blob/a14638581b4c8ef175e68dccff07967d819b3b7e/mysys/my_malloc.c#L130

          1. my_free
          2. my_realloc
          3. my_malloc

          Ideally logging a returned (using ``print pointer, my_flags, size``) pointer, flags and size from malloc/realloc calls, the oldptr from the realloc call, and the ptr argument from the free call. At each of these breakpoints logging the backtrace of the current thread. Hopefully the output from this with a bit of analysis can identify the backtrack where memory is allocated by not freed.

          gdb can attach to a process (using -p) and there is a batch mode for the script.

          I feel your pain about hard to debug memory leaks (mine was my second bug report MDEV-4974). Wish I'd though of this at that time (but I didn't know enough then).

          PS. If you do write the gdb script please include if for someone else

          danblack Daniel Black added a comment - Disclaimer: this is a rough concept only that require testing in a non-production environment obviously. Disclaimer 2: This is general advice from a community user and I also don't have much time but feel your pain enough to offer this on an as is basis. I'd be looking at something like this to use gdb to attach to the running process and print out information http://www.outofcore.com/2011/06/scripted-debug-using-gdb/ . So trapped points would be (from source mysys/my_malloc.c): https://github.com/MariaDB/server/blob/a14638581b4c8ef175e68dccff07967d819b3b7e/mysys/my_malloc.c#L130 my_free my_realloc my_malloc Ideally logging a returned (using ``print pointer, my_flags, size``) pointer, flags and size from malloc/realloc calls, the oldptr from the realloc call, and the ptr argument from the free call. At each of these breakpoints logging the backtrace of the current thread. Hopefully the output from this with a bit of analysis can identify the backtrack where memory is allocated by not freed. gdb can attach to a process (using -p) and there is a batch mode for the script. I feel your pain about hard to debug memory leaks (mine was my second bug report MDEV-4974 ). Wish I'd though of this at that time (but I didn't know enough then). PS. If you do write the gdb script please include if for someone else
          serg Sergei Golubchik added a comment - - edited

          Did you look at `MEMORY_USED` values in `INFORMATION_SCHEMA.PROCESSLIST` and `SHOW STATUS`? Anything notable?

          serg Sergei Golubchik added a comment - - edited Did you look at `MEMORY_USED` values in `INFORMATION_SCHEMA.PROCESSLIST` and `SHOW STATUS`? Anything notable?

          Thanks for the replies and info!

          `select MEMORY_USED from INFORMATION_SCHEMA.PROCESSLIST;` looks fine. I took that a step further and shut off the application in my test environment and confirmed no connections to the db other than my session (MEMORY_USED confirmed to no longer show those processes). The memory usage stops getting worse with the db idle (expected), but doesn’t release any memory either. The mysqld process still shows it is still using much more memory than it should be when taking into account relevant cache and buffer pool values (innodb_buffer_pool_size + innodb_additional_mem_pool_size + innodb_log_buffer_size + query_cache_size). I have left my test off for several hours now, to confirm mysqld memory use stays the same.

          andygabby Andrew Gabbitas added a comment - Thanks for the replies and info! `select MEMORY_USED from INFORMATION_SCHEMA.PROCESSLIST;` looks fine. I took that a step further and shut off the application in my test environment and confirmed no connections to the db other than my session (MEMORY_USED confirmed to no longer show those processes). The memory usage stops getting worse with the db idle (expected), but doesn’t release any memory either. The mysqld process still shows it is still using much more memory than it should be when taking into account relevant cache and buffer pool values (innodb_buffer_pool_size + innodb_additional_mem_pool_size + innodb_log_buffer_size + query_cache_size). I have left my test off for several hours now, to confirm mysqld memory use stays the same.
          danblack Daniel Black added a comment - - edited

          Could this be the same as MDEV-11883?
          Edit: never mind - its probably not. that has to do with read only filesystems.

          danblack Daniel Black added a comment - - edited Could this be the same as MDEV-11883 ? Edit: never mind - its probably not. that has to do with read only filesystems.

          Is it a master or a slave? File names in attachment suggest that it could be a master, but it has rpl-do-db and a big gtid_slave_pos, so it's unclear.

          elenst Elena Stepanova added a comment - Is it a master or a slave? File names in attachment suggest that it could be a master, but it has rpl-do-db and a big gtid_slave_pos, so it's unclear.
          andygabby Andrew Gabbitas added a comment - - edited

          It is only the master that has the problem.

          We have been able to narrow down where the problem resides.

          We are using per query timeouts. Here is an example from the attached binlog.

          SET STATEMENT max_statement_time=4.655, long_query_time=3.9200000000000004, sql_mode='STRICT_ALL_TABLES' FOR ....
          

          We made a modification our app to remove the prefix as a test, and we could no longer reproduce the memory leak. Changing the timeouts from per query to per session does dramatically slow the memory leak, but doesn't look to resolve it completely.

          andygabby Andrew Gabbitas added a comment - - edited It is only the master that has the problem. We have been able to narrow down where the problem resides. We are using per query timeouts. Here is an example from the attached binlog. SET STATEMENT max_statement_time=4.655, long_query_time=3.9200000000000004, sql_mode='STRICT_ALL_TABLES' FOR .... We made a modification our app to remove the prefix as a test, and we could no longer reproduce the memory leak. Changing the timeouts from per query to per session does dramatically slow the memory leak, but doesn't look to resolve it completely.

          People

            elenst Elena Stepanova
            andygabby Andrew Gabbitas
            Votes:
            2 Vote for this issue
            Watchers:
            7 Start watching this issue

            Dates

              Created:
              Updated:

              Git Integration

                Error rendering 'com.xiplink.jira.git.jira_git_plugin:git-issue-webpanel'. Please contact your Jira administrators.